Moving Average with Spark
Working with moving averages will give us a better idea of the time series, due large historical trends are much easier to analyze with moving averages. Moving averages are frequently used in financial analysis and Oil and Gas operations. In this repository I will use the data for daily stock prices of two particular companies
- The name of the company: ARMADA HOFFLER PROPERTIES, INC.
- The sector of the company : FINANCE
- The industry of the company: REAL ESTATE
- The name of the exchange : NYSE
- The symbol for the stock: AHH
AND
- The name of the company: PROPERTY INSURANCE HOLDINGS, INC.
- The sector of the company : FINANCE
- The industry of the company: PROPERTY-CASUALTY INSURERS
- The name of the exchange : NASDAQ
- The symbol for the stock: PIH
The dataset is at the following URL: Daily Historical Stock Prices (1970 - 2018)
Definition
The N-day moving average of a stock prices time series is defined as follows. Suppose we have our daily (close time) stock prices represented in a vector [p_1, p_2, …, p_M], where M is the number of prices. Then, the N-day moving averages of this series is another series defined by
[
(p_1 + p_2 + … + p_N) / N,
(p_2 + p_3 + … + p_{N + 1}) / N,
…, (p_{M - N + 1}, p_{M - N + 2}, …, p_M) / N
],
(where N <= M).
That is, we take “windows” of N-days periods, and average our data along these windows, producing a series consisting of averages on these windows.
Let’s get started
I will use the tool Databricks, is the name of the data analytics platform based on Apache Spark developed by the company with the same name.
Data preparation
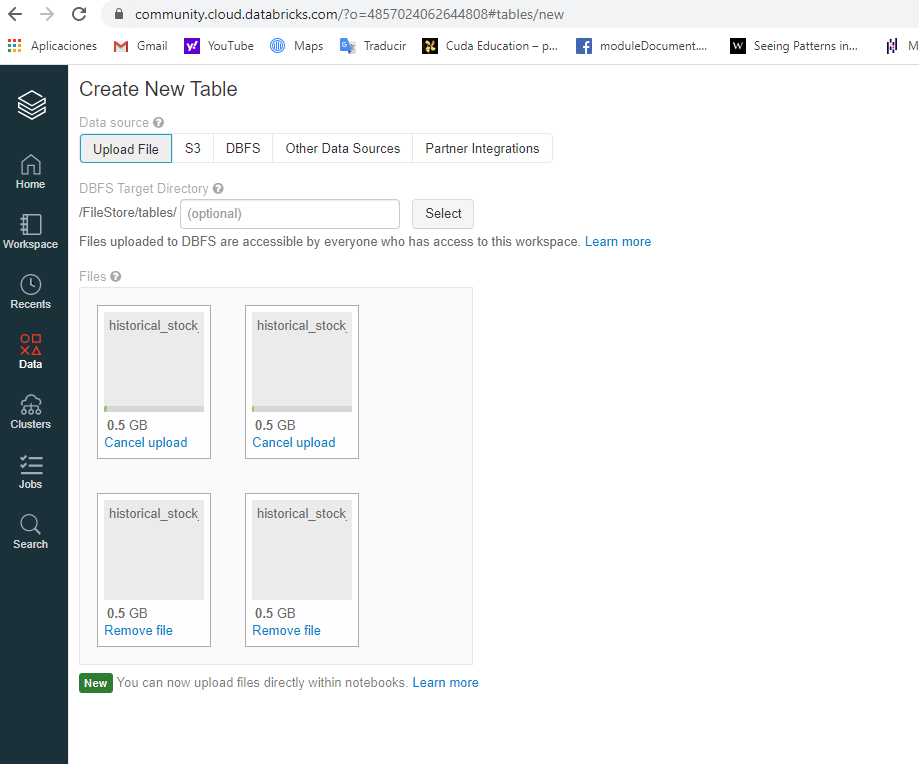
- Due that Databricks Community Edition will not allow to upload files more than 1gb, the original dataset was splitted into 4 chunks, in order to upload the original dataset to Databricks.
- The script to divide the file into chunks is explained below, it was executed locally using Google Colab.
import csv
import os
import sys

def split_csv(sfp, dest, prefix, size_chunk):
    if size_chunk <= 0:
        return

    with open(sfp, 'r') as s:
        reader = csv.reader(s)
        headers = next(reader)
        fn = 0
        exist = True

        while exist:
            i = 0
            t_filename = f'{prefix}_{fn}.csv'
            t_filepath = os.path.join(dest, t_filename)
            with open(t_filepath, 'w', newline='') as target:
                writer = csv.writer(target)
                while i < size_chunk:
                    if i == 0:
                        writer.writerow(headers)
                    try:
                        writer.writerow(next(reader))
                        i += 1
                    except:
                        exist = False
                        break
            if i == 0:
                os.remove(t_filepath)
            fn += 1

split_csv('/data/historical_stock_prices.csv', '/data/chunks/', 'historical_stock_prices_', 5300000)

- The chunks were stored into the next location in databricks: /FileStore/tables/…./
- All the chunks will be read in the same execution and all records from different chunks will be part of the same dataframe, Initially 31347778 records were found.
 file_location = "/FileStore/tables/..../"
file_type = "csv"

infer_schema = "true"
first_row_is_header = "true"
delimiter = ","
customSchema = StructType([StructField('ticker', StringType(), True),
                     StructField('open', DoubleType(), True),
                     StructField('close', DoubleType(), True),
                     StructField('adj_close', DoubleType(), False),
                     StructField('low', DoubleType(), True),
                     StructField('high', DoubleType(), True),
                     StructField('volume', IntegerType(), True),
                     StructField('date', DateType(), True)])

df = spark.read.format(file_type) \
               .option("header", first_row_is_header) \
               .option("sep", delimiter) \
               .schema(customSchema) \
               .load(file_location)
df1.printSchema()
df.count()
- The following scripts were used to observe and confirm the presence of duplicate records and drop them, after the execution 20973889 were found.
df1=df.groupBy("ticker","open","close","adj_close", "low", "high", "volume", "date")
      .count()
      .filter("count > 1")
df1.show(100)

df = df.drop_duplicates()
df.count()
- The following was used to drop missing records, after the execution 20973744 were found.
df = df.na.drop()
df.count()
- Filtering the original dataframe with the two companies mentioned above.
dfAHHPIH = df.select("ticker", "close", "date")
             .where("ticker =='AHH' OR  ticker == 'PIH'")
             .orderBy("date", ascending=True)

print(dfAHHPIH.count())
- Now we are computing the moving average of the close by the ticker AHH and PIH, the wma function is the function that will be applied for each window of rows
wma = Window.partitionBy('ticker') \
                 .orderBy("date") \
                 .rowsBetween(-7, 0)

dfAHHPIH = dfAHHPIH.withColumn('7MA', avg("close").over(wma))
- Knowing that the first 6 data points shouldn’t have a moving average (not enough data for 7MA), we’ll nullify them :
dfAHHPIH = dfAHHPIH.withColumn("mid", monotonically_increasing_id()) \
                        .withColumn("7MA", when(col("mid")<= 5, lit(None)).otherwise(col("7MA"))) \
                        .drop("mid")
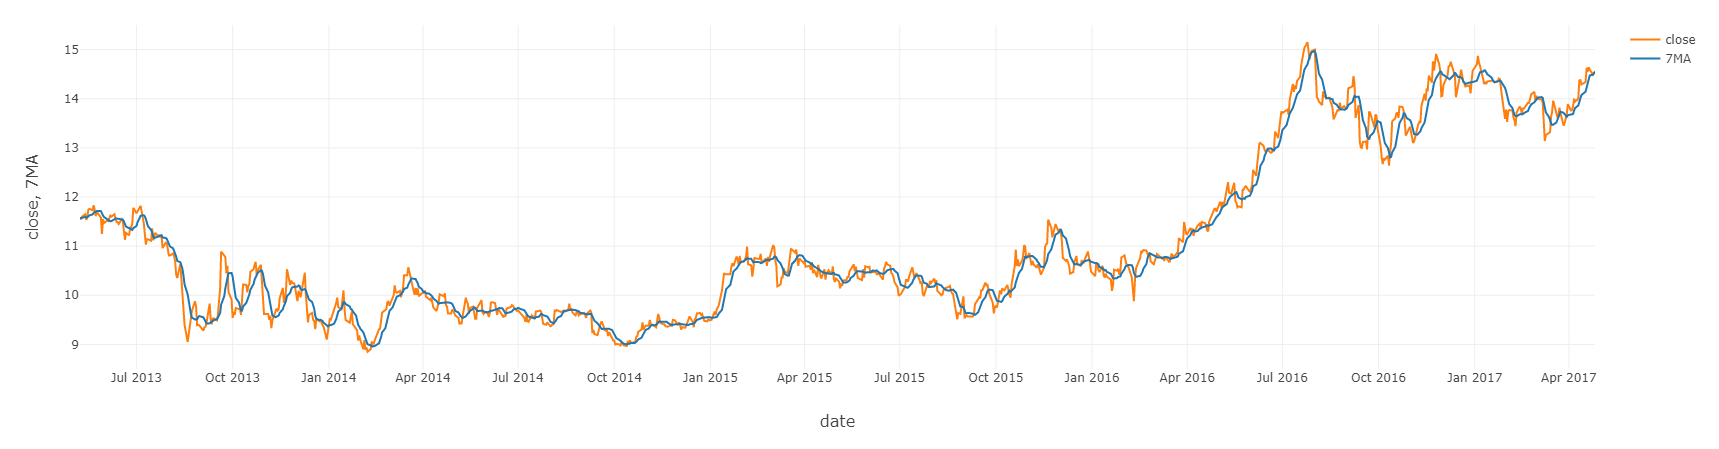
- Checking the columns 7MA and ticker for PIH
display(dfAHHPIH.filter(df['ticker'] =='PIH'))
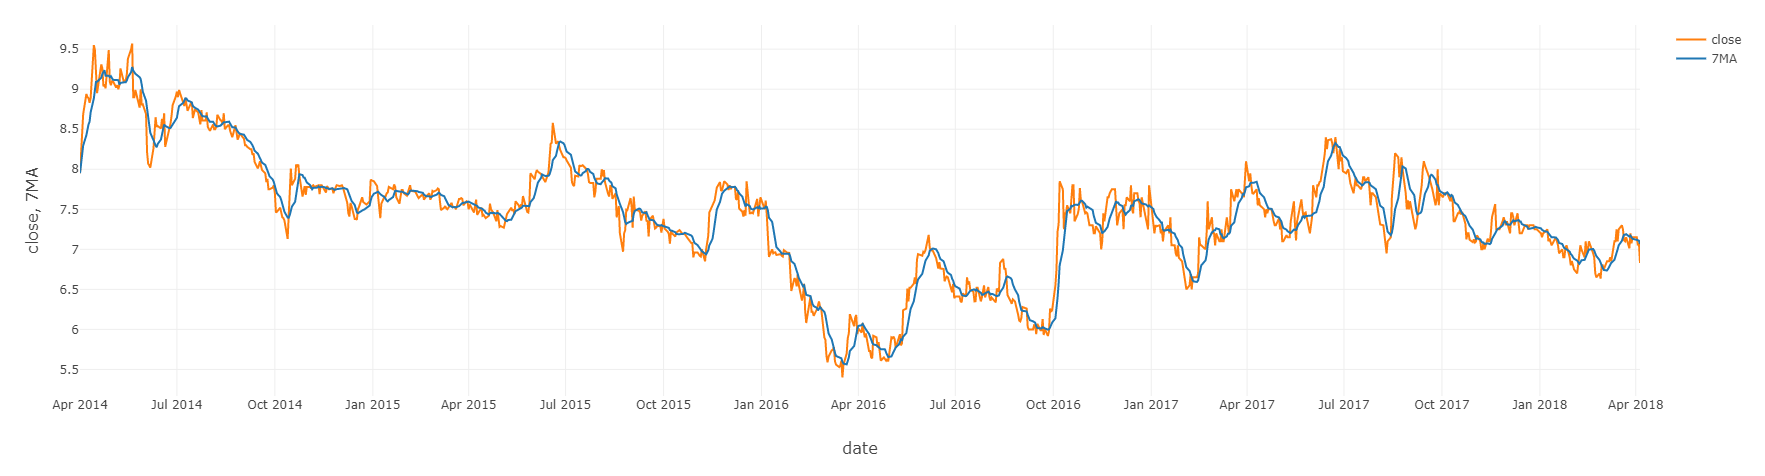
- Checking the columns 7MA and ticker for AHH
display(dfAHHPIH.filter(df['ticker'] =='AHH'))
Code
The databricks code is at the following URL: DataBricks Code
The Whole code here as well: Code
Contributing and Feedback
Any ideas or feedback about this repository?. Help me to improve it.
Authors
- Created by Ramses Alexander Coraspe Valdez
- Created on Nov, 2020
License
This project is licensed under the terms of the MIT license.