Dropout Students Prediction
The goal of this project is to identify students at risk of dropping out the school
Check the code here
Introduction
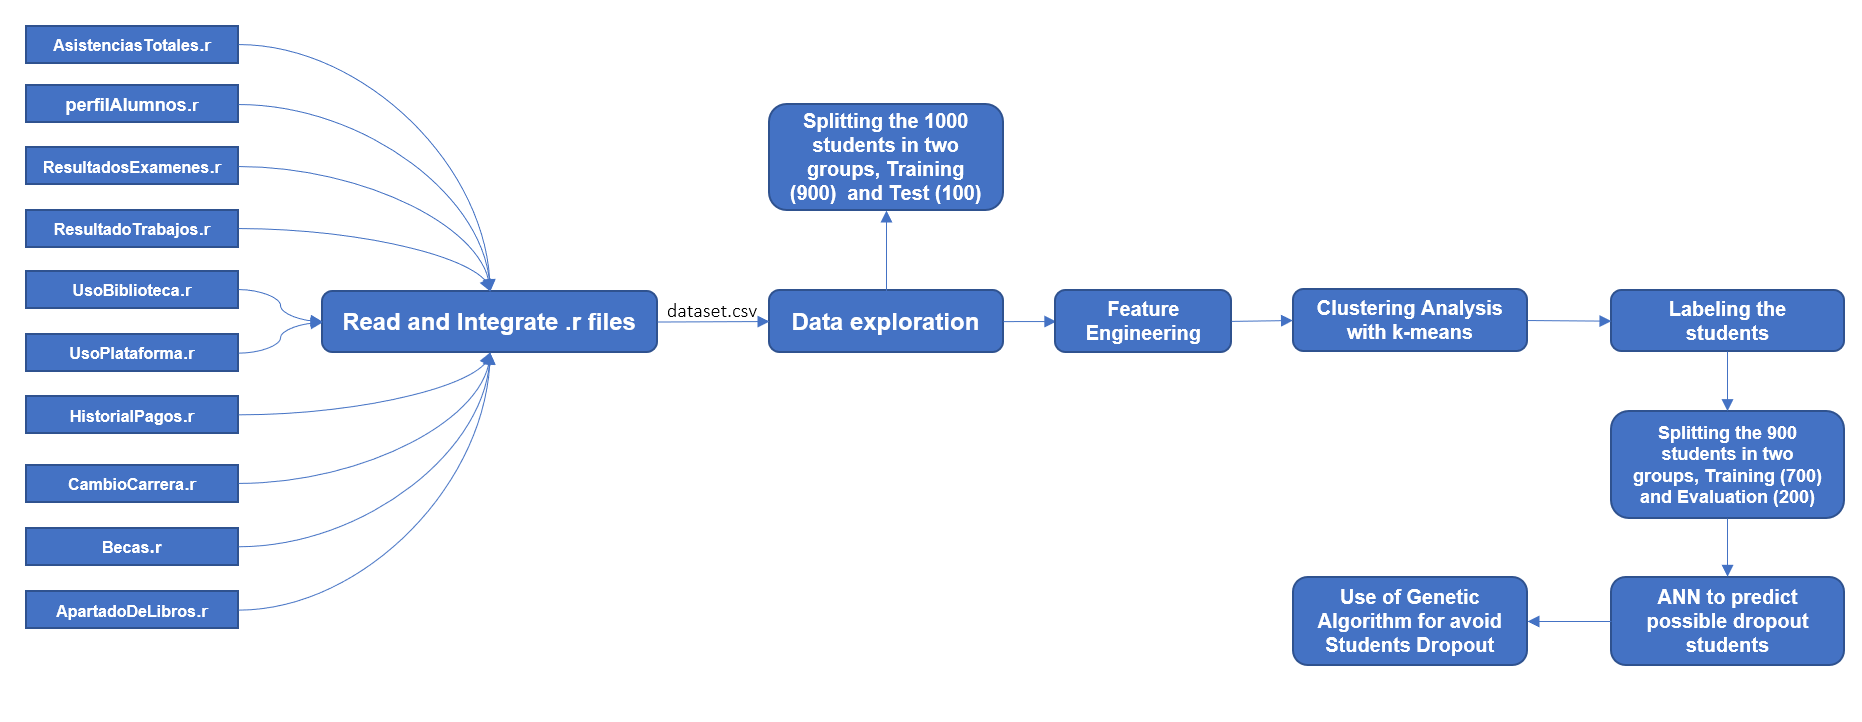
From a set of files which contains information about the first two semesters of 1000 students, they must be integrated into a single file for subsequent analysis, the final file must be separated into three groups: - 100 Students for Testing - 200 Students to Evaluate the Model - 700 Students to Train the Model. The students are not labeled, so a descriptive analysis of the data is required, kmeans must be used to be able to labeled the data based on a clustering analysis, once the students are labeled. An artificial neural network must be used to train a model In order to predict which students will dropout. Once the model is built, the Test dataset of 100 students must be used to know which of them will dropout, so It will use a genetic algorithm that can optimize the resources of the university in order to offer opportunities to students and thus avoid dropping out.
Check the code here
Methodology
Check the code here
Development
Variable selection and feature engineering
- genero : Male or female (0 or 1)
- admision.letras : Decimal number that represents the student’s grade on their high school entrance exam.
- admision.numeros: Decimal number, represents the student’s grade on their high school entrance exam.
- promedio.preparatoria : Decimal number, represents the final student’s score on their high school.
- edad.ingreso :Integer number, age of the student
- evalucion.socioeconomica : Represents the economic situation of their family, there are 4 levels, a higher number represents a lower socioeconomic level
- f_as_1: Integer number, represents the percentage of absences that the student had in semester 1, a higher number is bad, a lower number is better.
- f_as_2: Integer number, represents the percentage of absences that the student had in semester 2, a higher number is bad, a lower number is better.
- f_examenes_1: Represents the average score obtained in semester 1
- f_examenes_2: Represents the average score obtained in semester 2
- f_trabajos_1 : Represents the homeworks average score obtained in semester 1
- f_trabajos_2: Represents the homeworks average score obtained in semester 2
- f_bibl_1: Integer number, It is a factor that represents the times that the student exceeds the average of general use of the library in semester 1
- f_bibl_2: Integer number, It is a factor that represents the times that the student exceeds the average of general use of the library in semester 2
- f_plat_1:Integer number, It is a factor that represents the times that the student exceeds the average use of the school platform in semester 1
- f_plat_2: Integer number, It is a factor that represents the times that the student exceeds the average use of the school platform in semester 2
- f_libros_1: Integer number, It is a factor that represents the times that the student exceeds the average use of the books of the school in semester 1
- f_libros_2: Integer number, It is a factor that represents the times that the student exceeds the average use of the books of the school in semester 2
- distribucion.becas: The student has a scholarship or not
- f_pagos_status: This variable indicates if the student has delays in school payments.
- cambio.carrera: This variable indicate if the student has already changed career
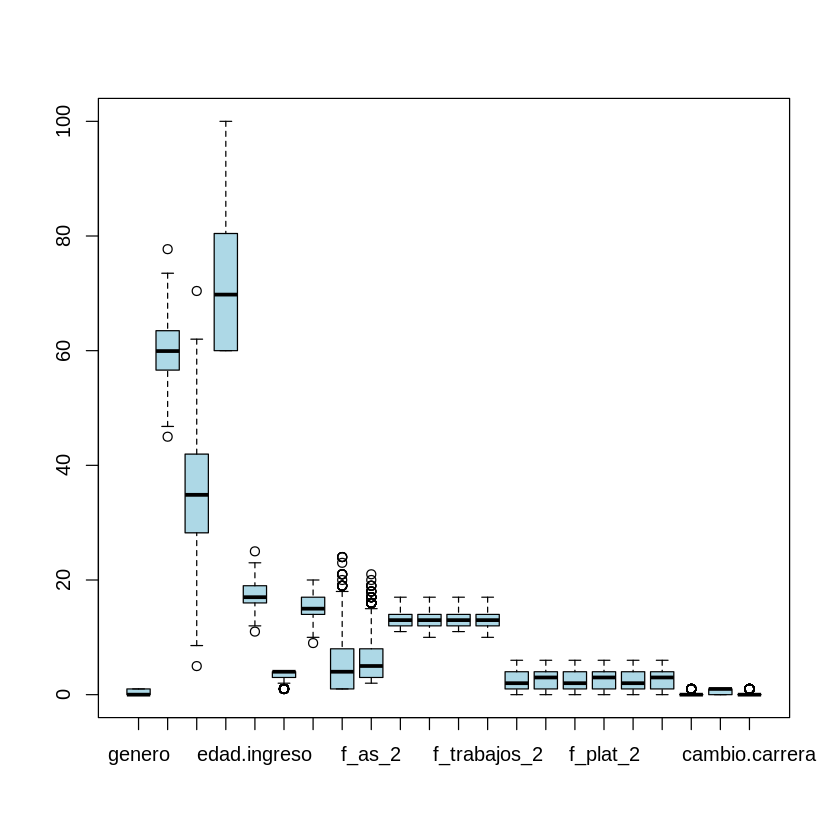
The variables are not yet scaled, then we will have to scale and standardize the variables, therefore many outliers are shown
There are variables giving the same information, they are highly correlated, will have to be removed from the original dataset.
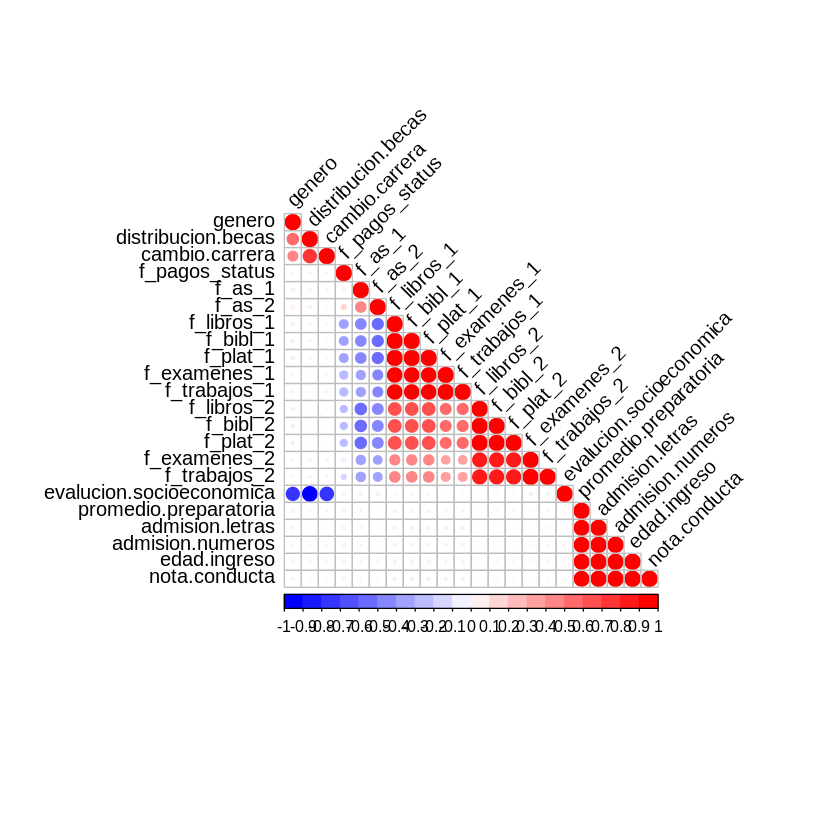
The following variables were removed from the dataset:
- nota.conducta
- f_plat_1
- f_plat_2
- f_libros_1
- f_libros_2
- f_trabajos_1
- f_trabajos_2
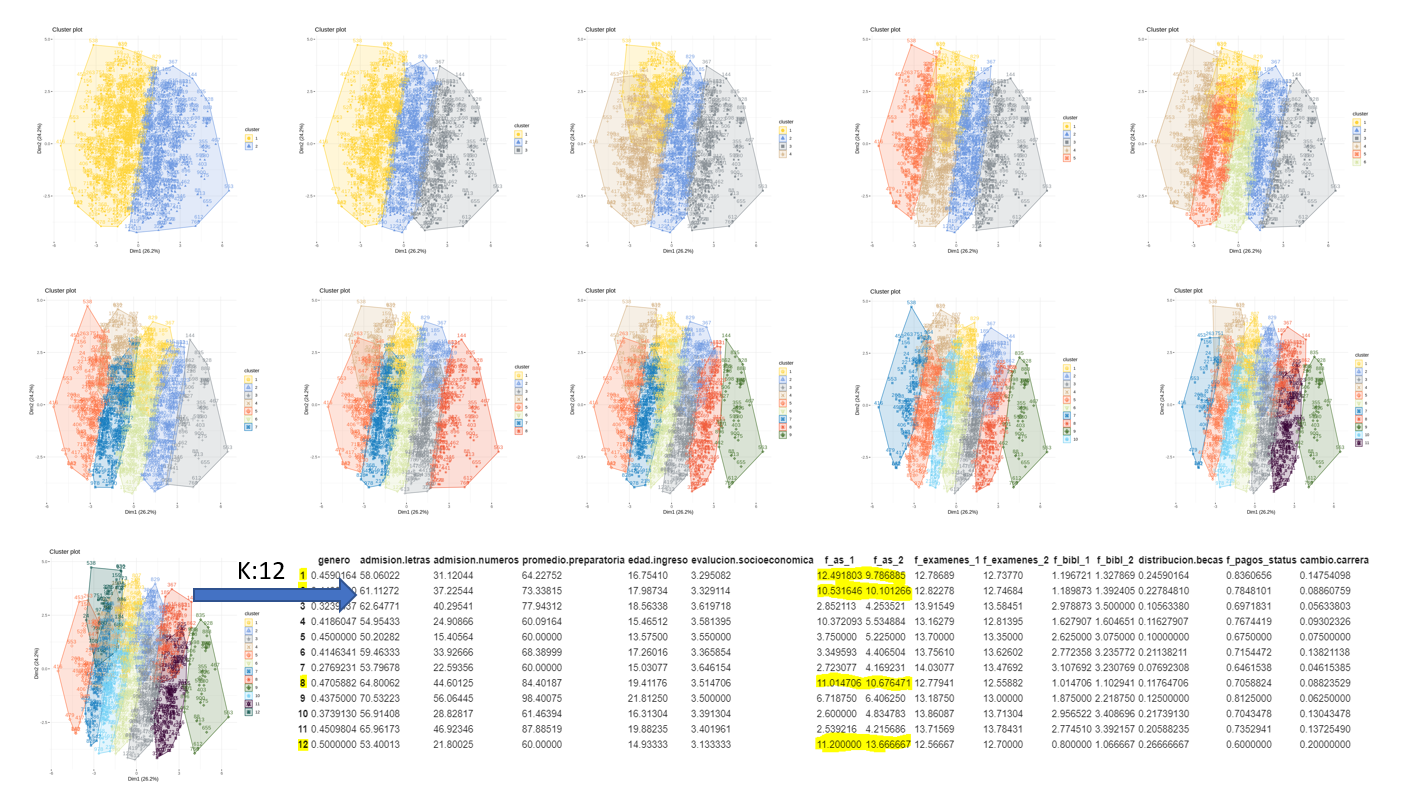
Clustering Analysis with k-means
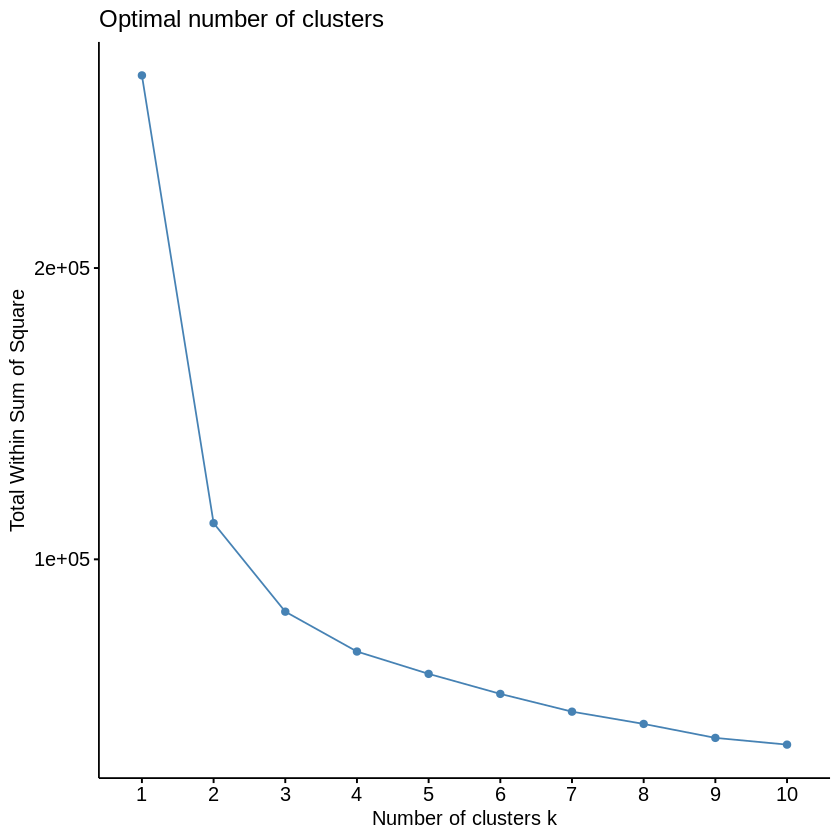
The answer given by the elbow method does not offer an suitable segmentation to be able to separate the possible students who could dropout from those who not, therefore the clusters were visualized and the centroids on these clusters, The table below was used to make a decision, the variables with the most strengths are:
- f_as_1
- f_as_2
- f_examenes_1
- f_examenes_2
- f_bibl_1
- f_bibl_2
- distribucion.becas
- f_pagos_status
- cambio.carrera
ANN (Layers and Neurons by Layers of the Neural Network)
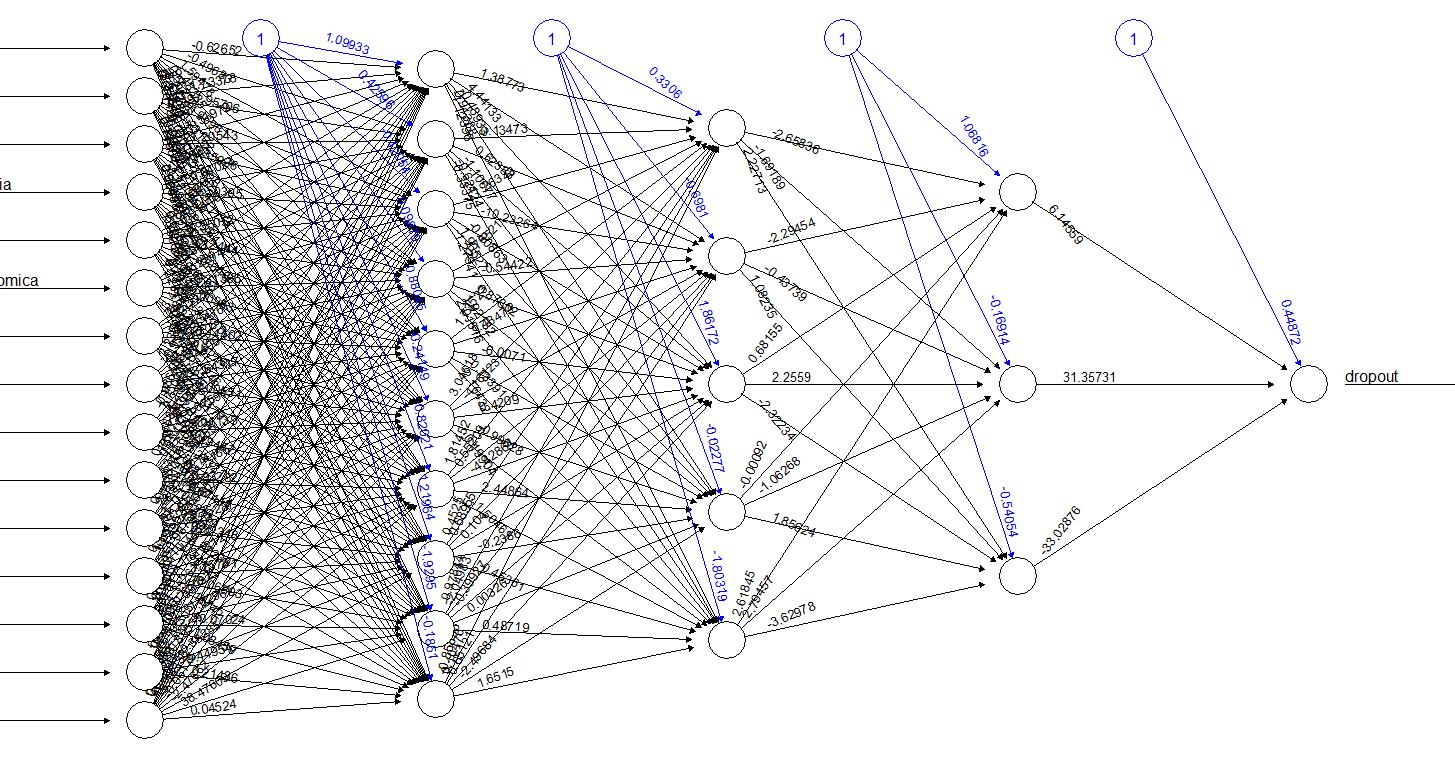
Model Accuracy: 94%
Confusion Table:
| 0 | 0 | |
|---|---|---|
| 1 | 145 | 4 |
| 0 | 8 | 43 |
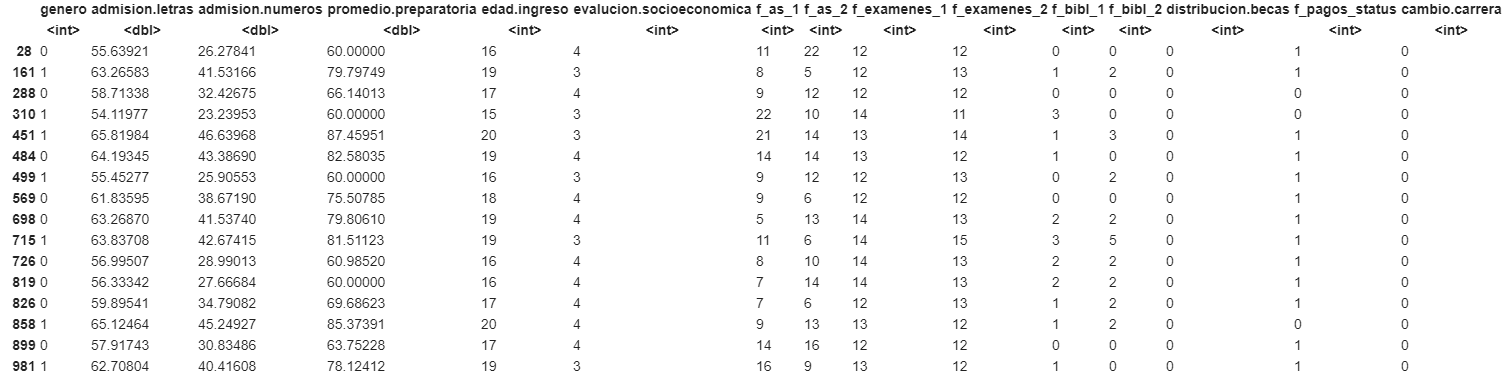
From the Test set of 100 students only 16 were selected as possible candidates to dropout
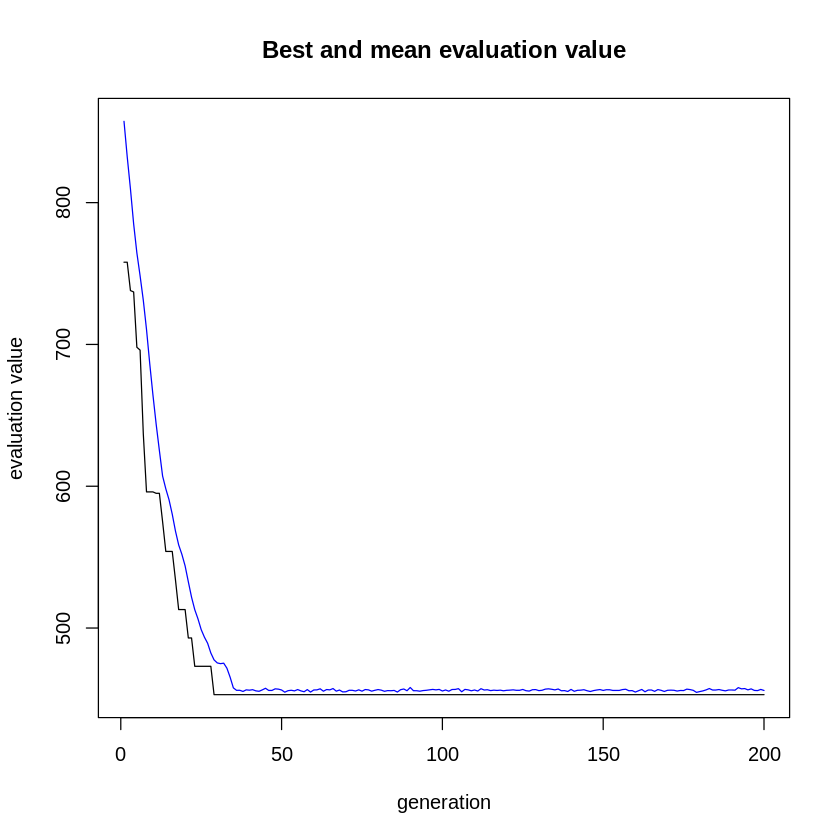
Use of Genetic Algorithm for avoid Students Dropout
The university has a budget of 10,000 USD and this money must be distributed correctly among the students who are likely to dropout, the genetic algorithm will help us find the best distribution fairly based on the information that is being provided by the fittness function, the size of the chromosome is expressed as:
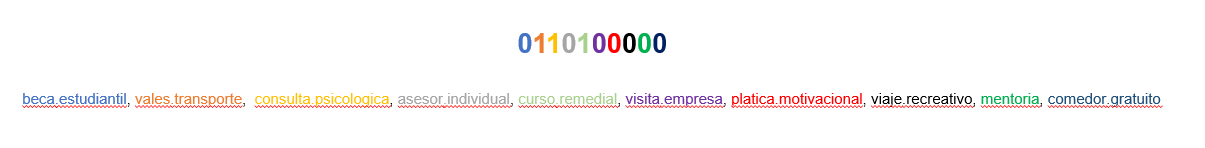
size: (n_students * n_features) n_students: Students who are going to drop out n_features: Features offered by the university to avoid possible dropouts.
For this case we have a choromosome of 160 genes or bits where each n_features-bit chunk represents the features selected by the algorithm for a single student.
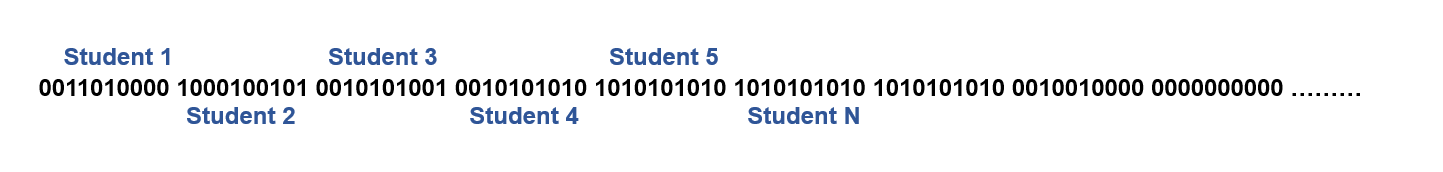
Each chunk of size “n_features” represents the genes of student N, and each gene will represent the possible characteristics that the university will give:
Among the considerations that the fittnes function will take to improve the distribution of resources are:
- A scholarship will not be given to students who already have a scholarship, if this happens it is penalized.
- Scholarships will only be given to students with a socioeconomic level of value 4.
- If the student under the age of 22 and have already dropped out, could be motivational problems.
- If the student had a high average score in the high school, without a scholarship and is also of a socioeconomic level 4, obviously the fittnes function will be penalized, since this student already showed patterns of good performance.
Check the code here
Conclusions and Comments
- The information in the dataset is almost uniform, this is because a synthetic method was used to generate this data.
- A value of K = 12 clusters was used to be able to observe in several clusters which students had the lowest levels, the elbow method suggested much lower values, but the segmentations offered by the method did not have the main features for the goal of this project.
- There were a mix of high-performance and low-performance students, students from high socioeconomic levels who did not pay on time and also had already dropout and had very high score averages in high school and college. A large number of clusters allowed me to see small groups of students with low performance.
- 7 features were removed because they were suplying the same information
- The Evaluation of the model with the dataset of 200 students showed an accuracy of 94%.
- From the Test set of 100 students, the neural network was able to identify 16 of them which could dropout
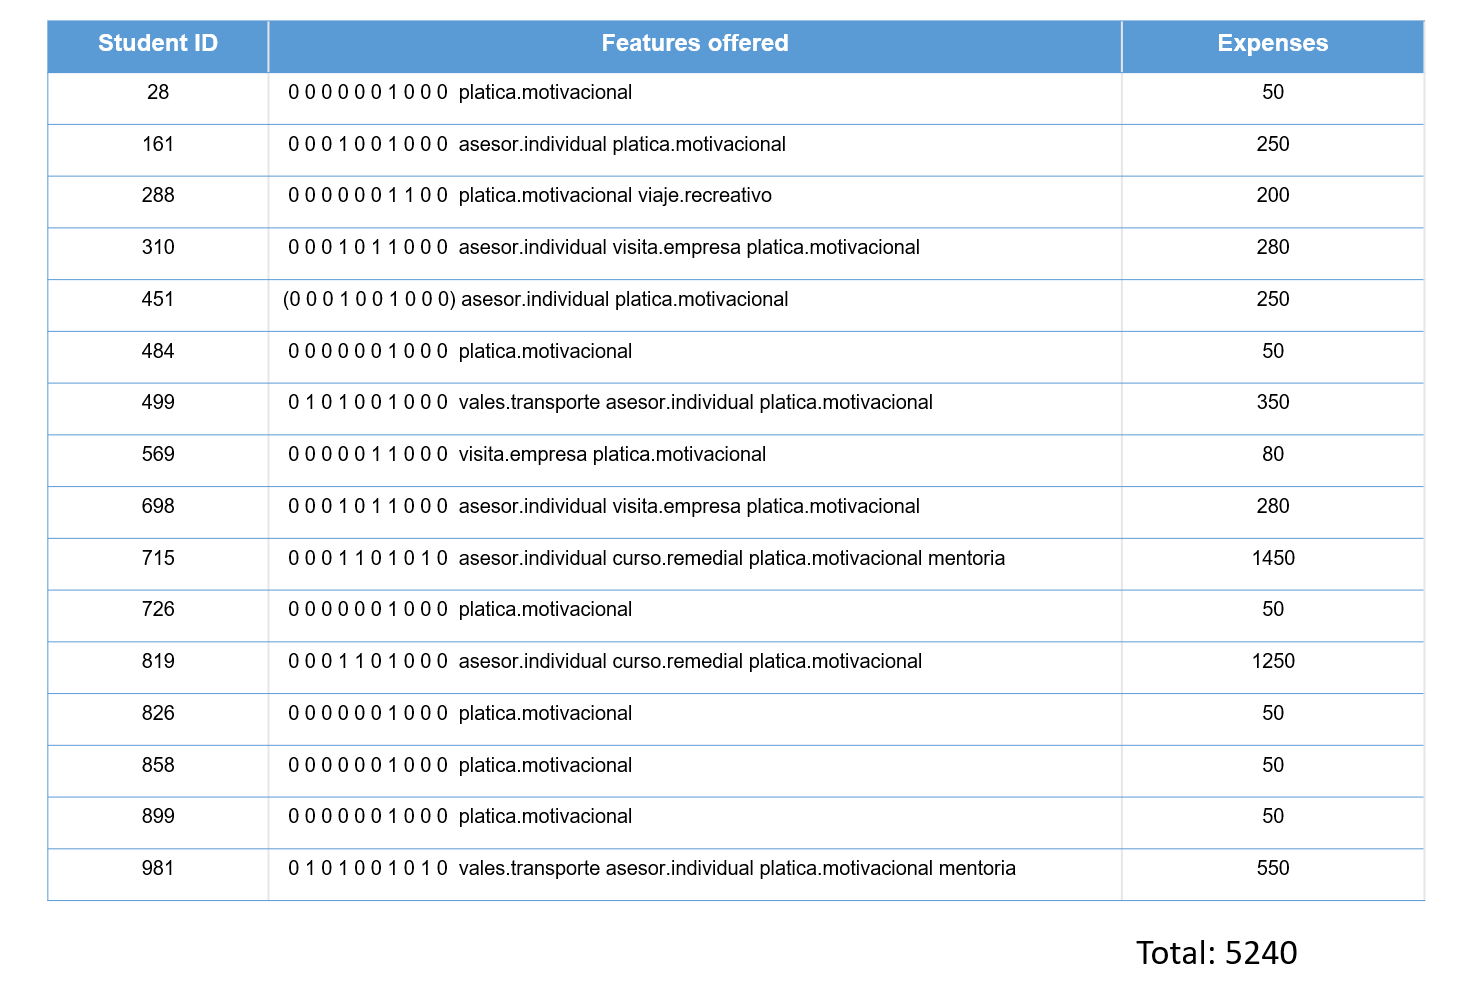
- The results of the correct distribution of the resources offered by the genetic algorithm are as follows:
- The entire budget was not used so there was a saving of (10000 USD - 5240 USD) = 4760 USD
Finalbudget <- 0
best <- ga.one$population[ga.one$evaluations == min(ga.one$best),][1,]

iter <- 1
for(i in 1:n_students) {

    best_genes <- best[iter:(n_features * i)]
    print(rownames(dropout_students[dropout_students$id_alumno==i,]))
    print(best_genes)
    best.items <- items$student.features[best_genes == 1]
    print(best.items)
    Finalbudget <- Finalbudget + best_genes %*% items$budget.features
    iter <- iter + n_features
}

Finalbudget
Comments
The project was very complete and is closer to the reality of a project with unlabeled data, an unsupervised learning technique was used that was effective, the work of finding the clusters to be able to label the students was a difficult job, also i think that the integration process should be by using an ETL tool and not using the .R script
Check the code here
Contributing and Feedback
Any ideas or feedback about this repository?. Help me to improve it.
Authors
- Created by Ramses Alexander Coraspe Valdez
- Created on 2020
License
This project is licensed under the terms of the MIT license.