Clustering the countries needing international AID with R

Created by Ramses Alexander Coraspe Valdez

Created on July 17, 2020

Installing libraries

In [233]:
# install.packages("tidyverse")
# install.packages("cluster")
# install.packages("factoextra")
# install.packages("corrplot")
# install.packages("party")
library(party)
library(tidyverse)  # data manipulation
library(cluster)    # clustering algorithms
library(factoextra) # clustering algorithms & visualization
library(corrplot)
In [234]:
normalize <- function(x) {
return ((x - min(x)) / (max(x) - min(x)))
}

Checking the data

In [235]:
countries.data <- read.csv("datasets_Country_data.csv", stringsAsFactors = F)
countries.dict <- read.csv("countries_dict.csv", stringsAsFactors = F)

countries.data <- transform(countries.data, income   = as.numeric(income), gdpp = as.numeric(gdpp))

head(countries.data,10)                                                                  
head(countries.dict,20)
A data.frame: 10 × 10
countrychild_mortexportshealthimportsincomeinflationlife_expectotal_fergdpp
<chr><dbl><dbl><dbl><dbl><dbl><dbl><dbl><dbl><dbl>
1Afghanistan 90.210.0 7.5844.9 1610 9.44056.25.82 553
2Albania 16.628.0 6.5548.6 9930 4.49076.31.65 4090
3Algeria 27.338.4 4.1731.41290016.10076.52.89 4460
4Angola 119.062.3 2.8542.9 590022.40060.16.16 3530
5Antigua and Barbuda 10.345.5 6.0358.919100 1.44076.82.1312200
6Argentina 14.518.9 8.1016.01870020.90075.82.3710300
7Armenia 18.120.8 4.4045.3 6700 7.77073.31.69 3220
8Australia 4.819.8 8.7320.941400 1.16082.01.9351900
9Austria 4.351.311.0047.843200 0.87380.51.4446900
10Azerbaijan 39.254.3 5.8820.71600013.80069.11.92 5840
A data.frame: 10 × 2
Column.NameDescription
<chr><chr>
1country Name of the country
2child_mortDeath of children under 5 years of age per 1000 live births
3exports Exports of goods and services per capita. Given as %age of the GDP per capita
4health Total health spending per capita. Given as %age of GDP per capita
5imports Imports of goods and services per capita. Given as %age of the GDP per capita
6Income Net income per person
7Inflation The measurement of the annual growth rate of the Total GDP
8life_expecThe average number of years a new born child would live if the current mortality patterns are to remain the same
9total_fer The number of children that would be born to each woman if the current age-fertility rates remain the same.
10gdpp The GDP per capita. Calculated as the Total GDP divided by the total population.
In [236]:
countries <- countries.data$country  
countries.data$country =  NULL

countries.datan <- scale(countries.data)

row.names(countries.datan) <- countries
head(countries.datan,10)
A matrix: 10 × 9 of type dbl
child_mortexportshealthimportsincomeinflationlife_expectotal_fergdpp
Afghanistan 1.28765971-1.13486665 0.27825140-0.08220771-0.80582187 0.156864451-1.6142372 1.89717646-0.67714308
Albania-0.53733286-0.47822017-0.09672528 0.07062429-0.37424335-0.311410892 0.6459238-0.85739418-0.48416709
Algeria-0.27201464-0.09882442-0.96317624-0.63983800-0.22018227 0.786907640 0.6684130-0.03828924-0.46398018
Angola 2.00178723 0.77305618-1.44372888-0.16481961-0.58328920 1.382894441-1.1756985 2.12176975-0.51472026
Antigua and Barbuda-0.69354825 0.16018613-0.28603389 0.49607554 0.10142673-0.599944185 0.7021467-0.54032130-0.04169175
Argentina-0.58940465-0.81019144 0.46756001-1.27594958 0.08067776 1.240992822 0.5897009-0.38178486-0.14535428
Armenia-0.50013871-0.74087876-0.87944359-0.06568534-0.54179126-0.001119352 0.3085863-0.83097144-0.53163362
Australia-0.82992677-0.77735912 0.69691468-1.07355044 1.25818167-0.626432487 1.2868650-0.67243500 2.12430964
Austria-0.84232482 0.37177222 1.52331959 0.03757953 1.35155202-0.653582997 1.1181962-0.99611356 1.85151350
Azerbaijan 0.02305888 0.48121330-0.34064215-1.08181163-0.05937777 0.569325158-0.1636861-0.67904068-0.38868844

Checking the correlations

In [237]:
source("http://www.sthda.com/upload/rquery_cormat.r")

col<- colorRampPalette(c("blue", "white", "red"))(20)
rquery.cormat(countries.datan, type="full", col=col)
$r
           inflation child_mort total_fer exports imports health life_expec
inflation       1.00       0.29      0.32   -0.11  -0.250 -0.260     -0.240
child_mort      0.29       1.00      0.85   -0.32  -0.130 -0.200     -0.890
total_fer       0.32       0.85      1.00   -0.32  -0.160 -0.200     -0.760
exports        -0.11      -0.32     -0.32    1.00   0.740 -0.110      0.320
imports        -0.25      -0.13     -0.16    0.74   1.000  0.096      0.054
health         -0.26      -0.20     -0.20   -0.11   0.096  1.000      0.210
life_expec     -0.24      -0.89     -0.76    0.32   0.054  0.210      1.000
income         -0.15      -0.52     -0.50    0.52   0.120  0.130      0.610
gdpp           -0.22      -0.48     -0.45    0.42   0.120  0.350      0.600
           income  gdpp
inflation   -0.15 -0.22
child_mort  -0.52 -0.48
total_fer   -0.50 -0.45
exports      0.52  0.42
imports      0.12  0.12
health       0.13  0.35
life_expec   0.61  0.60
income       1.00  0.90
gdpp         0.90  1.00

$p
           inflation child_mort total_fer exports imports  health life_expec
inflation    0.00000    1.6e-04   3.0e-05 1.7e-01 1.3e-03 8.7e-04    1.8e-03
child_mort   0.00016    0.0e+00   1.8e-47 2.8e-05 1.0e-01 9.4e-03    3.7e-57
total_fer    0.00003    1.8e-47   0.0e+00 2.5e-05 4.0e-02 1.1e-02    8.3e-33
exports      0.17000    2.8e-05   2.5e-05 0.0e+00 6.4e-30 1.4e-01    3.1e-05
imports      0.00130    1.0e-01   4.0e-02 6.4e-30 0.0e+00 2.2e-01    4.9e-01
health       0.00087    9.4e-03   1.1e-02 1.4e-01 2.2e-01 0.0e+00    6.3e-03
life_expec   0.00180    3.7e-57   8.3e-33 3.1e-05 4.9e-01 6.3e-03    0.0e+00
income       0.05700    3.5e-13   4.9e-12 8.7e-13 1.2e-01 9.5e-02    1.6e-18
gdpp         0.00400    3.8e-11   6.6e-10 1.8e-08 1.4e-01 4.7e-06    1.0e-17
            income    gdpp
inflation  5.7e-02 4.0e-03
child_mort 3.5e-13 3.8e-11
total_fer  4.9e-12 6.6e-10
exports    8.7e-13 1.8e-08
imports    1.2e-01 1.4e-01
health     9.5e-02 4.7e-06
life_expec 1.6e-18 1.0e-17
income     0.0e+00 6.4e-60
gdpp       6.4e-60 0.0e+00

$sym
           inflation child_mort total_fer exports imports health life_expec
inflation  1                                                               
child_mort           1                                                     
total_fer  .         +          1                                          
exports              .          .         1                                
imports                                   ,       1                        
health                                                    1                
life_expec           +          ,         .                      1         
income               .          .         .                      ,         
gdpp                 .          .         .               .      .         
           income gdpp
inflation             
child_mort            
total_fer             
exports               
imports               
health                
life_expec            
income     1          
gdpp       +      1   
attr(,"legend")
[1] 0 ‘ ’ 0.3 ‘.’ 0.6 ‘,’ 0.8 ‘+’ 0.9 ‘*’ 0.95 ‘B’ 1

Checking for multiple Clusters

In [238]:
set.seed(123)

k2 <- kmeans(countries.datan, centers = 2, iter.max = 25, nstart = 1)
k3 <- kmeans(countries.datan, centers = 3, iter.max = 25, nstart = 1)
k4 <- kmeans(countries.datan, centers = 4, iter.max = 25, nstart = 1)
k5 <- kmeans(countries.datan, centers = 5, iter.max = 25, nstart = 1)
k6 <- kmeans(countries.datan, centers = 6, iter.max = 25, nstart = 1)

# plots to compare
p1 <- fviz_cluster(k2, geom = "point", data = countries.datan) + ggtitle("k = 2")
p2 <- fviz_cluster(k3, geom = "point",  data = countries.datan) + ggtitle("k = 3")
p3 <- fviz_cluster(k4, geom = "point",  data = countries.datan) + ggtitle("k = 4")
p4 <- fviz_cluster(k5, geom = "point",  data = countries.datan) + ggtitle("k = 5")
p5 <- fviz_cluster(k6, geom = "point",  data = countries.datan) + ggtitle("k = 6")

library(gridExtra)
grid.arrange(p1, p2, p3, p4, p5, nrow = 3)

Checking for the appropiate number of clusters with the Elbow method

In [239]:
set.seed(123)
fviz_nbclust(countries.datan, kmeans, method = "wss")

Insights about the K choosed (K=3)

The countries will be separated in three groups:

Countries that do not need international HELP

Countries on the verge of needing international HELP

Countries that definitely need international HELP

Lets clarify some features of this analysis before choosing the groups:

  • An higher inflation is bad
  • An higher child mortality is bad
  • An lower income is bad
In [240]:
set.seed(123)
k3 <- kmeans(countries.datan, centers = 3, iter.max = 25, nstart = 1)
attributes(k3)
k3$size
k3$centers

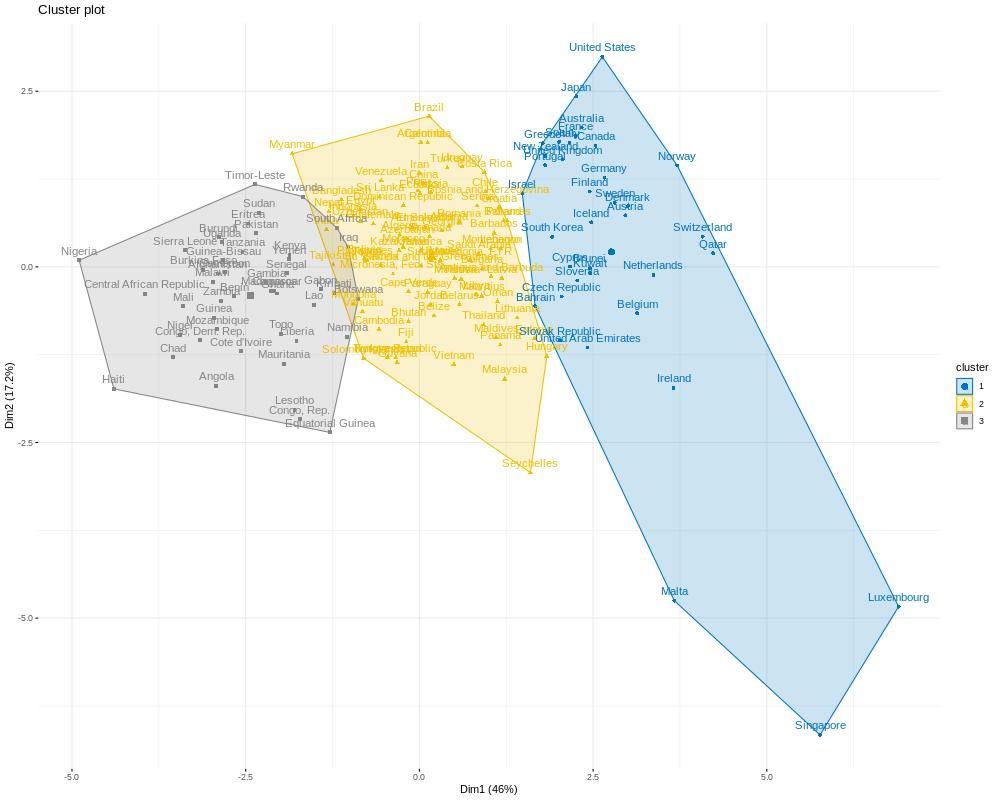
p2 <-  fviz_cluster(k3, data = countries.datan,
             ellipse.type = "convex",
             palette = "jco",
             ggtheme = theme_minimal())
p2
$names
  1. 'cluster'
  2. 'centers'
  3. 'totss'
  4. 'withinss'
  5. 'tot.withinss'
  6. 'betweenss'
  7. 'size'
  8. 'iter'
  9. 'ifault'
$class
'kmeans'
  1. 36
  2. 84
  3. 47
A matrix: 3 × 9 of type dbl
child_mortexportshealthimportsincomeinflationlife_expectotal_fergdpp
1-0.8249676 0.64314557 0.7252301 0.19006732 1.4797922-0.48346661 1.0763414-0.7895024 1.6111498
2-0.4052346-0.03155768-0.2237978 0.02408916-0.2510155-0.01711594 0.2539698-0.4230704-0.3534185
3 1.3561391-0.43622118-0.1555163-0.18863644-0.6848344 0.40090504-1.2783352 1.3608511-0.6024306
In [241]:
countries.datan <- cbind(countries.datan, cluster = k3$cluster)
countries.datan <- cbind(countries.datan, label = k3$cluster)
countries.datan <- as.data.frame(countries.datan)

countries.datan[countries.datan$cluster==1,]$label <- "non"
countries.datan[countries.datan$cluster==2,]$label <- "verge"
countries.datan[countries.datan$cluster==3,]$label <- "need"

countries.datan$label <- factor(countries.datan$label)
countries.datan <- cbind(countries.datan, country = countries)

The countries that urgently need international aid are those highlighted in the gray area, cluster number 3.

In [242]:
countries <- countries.datan[countries.datan$cluster==3,]$country
countries
  1. Afghanistan
  2. Angola
  3. Benin
  4. Botswana
  5. Burkina Faso
  6. Burundi
  7. Cameroon
  8. Central African Republic
  9. Chad
  10. Comoros
  11. Congo, Dem. Rep.
  12. Congo, Rep.
  13. Cote d'Ivoire
  14. Equatorial Guinea
  15. Eritrea
  16. Gabon
  17. Gambia
  18. Ghana
  19. Guinea
  20. Guinea-Bissau
  21. Haiti
  22. Iraq
  23. Kenya
  24. Kiribati
  25. Lao
  26. Lesotho
  27. Liberia
  28. Madagascar
  29. Malawi
  30. Mali
  31. Mauritania
  32. Mozambique
  33. Namibia
  34. Niger
  35. Nigeria
  36. Pakistan
  37. Rwanda
  38. Senegal
  39. Sierra Leone
  40. South Africa
  41. Sudan
  42. Tanzania
  43. Timor-Leste
  44. Togo
  45. Uganda
  46. Yemen
  47. Zambia
Levels:
  1. 'Afghanistan'
  2. 'Albania'
  3. 'Algeria'
  4. 'Angola'
  5. 'Antigua and Barbuda'
  6. 'Argentina'
  7. 'Armenia'
  8. 'Australia'
  9. 'Austria'
  10. 'Azerbaijan'
  11. 'Bahamas'
  12. 'Bahrain'
  13. 'Bangladesh'
  14. 'Barbados'
  15. 'Belarus'
  16. 'Belgium'
  17. 'Belize'
  18. 'Benin'
  19. 'Bhutan'
  20. 'Bolivia'
  21. 'Bosnia and Herzegovina'
  22. 'Botswana'
  23. 'Brazil'
  24. 'Brunei'
  25. 'Bulgaria'
  26. 'Burkina Faso'
  27. 'Burundi'
  28. 'Cambodia'
  29. 'Cameroon'
  30. 'Canada'
  31. 'Cape Verde'
  32. 'Central African Republic'
  33. 'Chad'
  34. 'Chile'
  35. 'China'
  36. 'Colombia'
  37. 'Comoros'
  38. 'Congo, Dem. Rep.'
  39. 'Congo, Rep.'
  40. 'Costa Rica'
  41. 'Cote d\'Ivoire'
  42. 'Croatia'
  43. 'Cyprus'
  44. 'Czech Republic'
  45. 'Denmark'
  46. 'Dominican Republic'
  47. 'Ecuador'
  48. 'Egypt'
  49. 'El Salvador'
  50. 'Equatorial Guinea'
  51. 'Eritrea'
  52. 'Estonia'
  53. 'Fiji'
  54. 'Finland'
  55. 'France'
  56. 'Gabon'
  57. 'Gambia'
  58. 'Georgia'
  59. 'Germany'
  60. 'Ghana'
  61. 'Greece'
  62. 'Grenada'
  63. 'Guatemala'
  64. 'Guinea'
  65. 'Guinea-Bissau'
  66. 'Guyana'
  67. 'Haiti'
  68. 'Hungary'
  69. 'Iceland'
  70. 'India'
  71. 'Indonesia'
  72. 'Iran'
  73. 'Iraq'
  74. 'Ireland'
  75. 'Israel'
  76. 'Italy'
  77. 'Jamaica'
  78. 'Japan'
  79. 'Jordan'
  80. 'Kazakhstan'
  81. 'Kenya'
  82. 'Kiribati'
  83. 'Kuwait'
  84. 'Kyrgyz Republic'
  85. 'Lao'
  86. 'Latvia'
  87. 'Lebanon'
  88. 'Lesotho'
  89. 'Liberia'
  90. 'Libya'
  91. 'Lithuania'
  92. 'Luxembourg'
  93. 'Macedonia, FYR'
  94. 'Madagascar'
  95. 'Malawi'
  96. 'Malaysia'
  97. 'Maldives'
  98. 'Mali'
  99. 'Malta'
  100. 'Mauritania'
  101. 'Mauritius'
  102. 'Micronesia, Fed. Sts.'
  103. 'Moldova'
  104. 'Mongolia'
  105. 'Montenegro'
  106. 'Morocco'
  107. 'Mozambique'
  108. 'Myanmar'
  109. 'Namibia'
  110. 'Nepal'
  111. 'Netherlands'
  112. 'New Zealand'
  113. 'Niger'
  114. 'Nigeria'
  115. 'Norway'
  116. 'Oman'
  117. 'Pakistan'
  118. 'Panama'
  119. 'Paraguay'
  120. 'Peru'
  121. 'Philippines'
  122. 'Poland'
  123. 'Portugal'
  124. 'Qatar'
  125. 'Romania'
  126. 'Russia'
  127. 'Rwanda'
  128. 'Samoa'
  129. 'Saudi Arabia'
  130. 'Senegal'
  131. 'Serbia'
  132. 'Seychelles'
  133. 'Sierra Leone'
  134. 'Singapore'
  135. 'Slovak Republic'
  136. 'Slovenia'
  137. 'Solomon Islands'
  138. 'South Africa'
  139. 'South Korea'
  140. 'Spain'
  141. 'Sri Lanka'
  142. 'St. Vincent and the Grenadines'
  143. 'Sudan'
  144. 'Suriname'
  145. 'Sweden'
  146. 'Switzerland'
  147. 'Tajikistan'
  148. 'Tanzania'
  149. 'Thailand'
  150. 'Timor-Leste'
  151. 'Togo'
  152. 'Tonga'
  153. 'Tunisia'
  154. 'Turkey'
  155. 'Turkmenistan'
  156. 'Uganda'
  157. 'Ukraine'
  158. 'United Arab Emirates'
  159. 'United Kingdom'
  160. 'United States'
  161. 'Uruguay'
  162. 'Uzbekistan'
  163. 'Vanuatu'
  164. 'Venezuela'
  165. 'Vietnam'
  166. 'Yemen'
  167. 'Zambia'

texto alternativo

Implementing CART

In [243]:
countries.datan$country <- NULL
In [244]:
set.seed(1234)
ind <- sample(x=c(1,2), size=nrow(countries.datan), replace=TRUE, prob=c(0.7, 0.3))
training.set <- countries.datan[ind==1,]
test.set <- countries.datan[ind==2,]
In [245]:
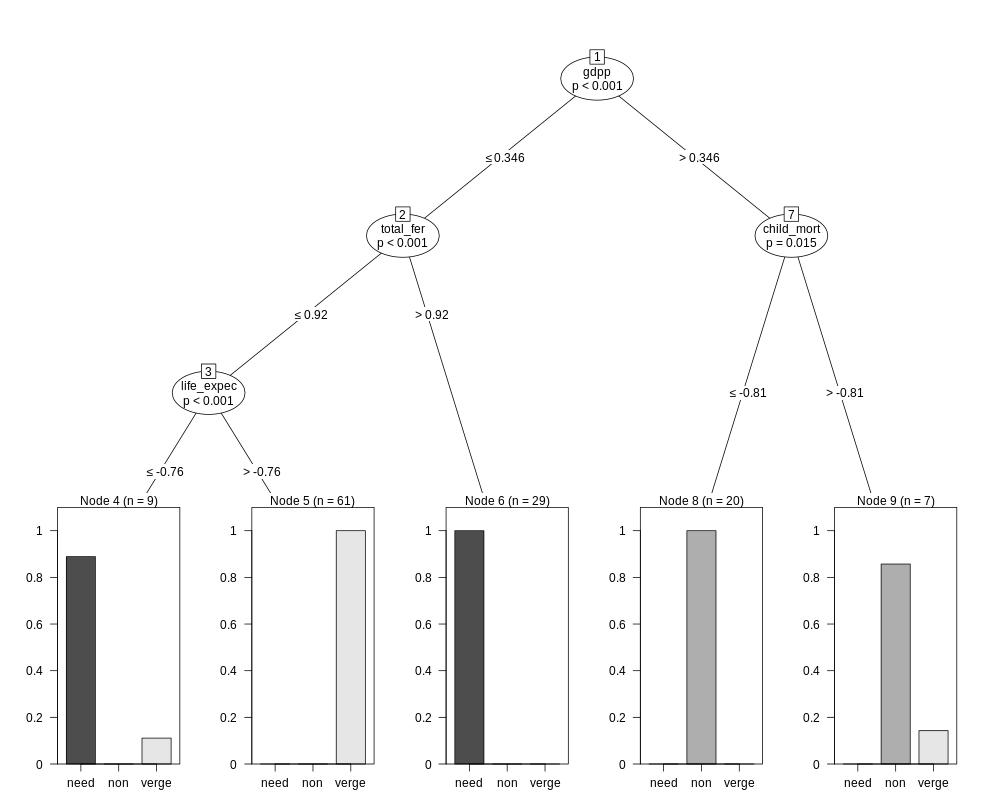
formula.1 <- label ~ child_mort + exports + health + imports + income + inflation + life_expec + total_fer + gdpp

countries_help.ctree <- ctree(formula = formula.1, data = training.set)

plot(countries_help.ctree)
In [246]:
train_predict <- predict(countries_help.ctree,training.set,type="response")
table(train_predict,training.set$label)
             
train_predict need non verge
        need    37   0     1
        non      0  26     1
        verge    0   0    61
In [247]:
error_rate <- mean(train_predict != training.set$label) * 100
accuracy <- (100 - error_rate)
accuracy
98.4126984126984
In [248]:
test_predict <- predict(countries_help.ctree, newdata= test.set,type="response")
table(test_predict, test.set$label)
error_rate <- mean(test_predict != test.set$label) * 100
accuracy <- (100 - error_rate)
accuracy
            
test_predict need non verge
       need     9   0     1
       non      0   9     0
       verge    1   1    20
92.6829268292683

texto alternativo